15% of the Bill. How Much of the Increase?
By ALDP Co-founders Michael Glassner and Jason Young
Sept. 29, 2026 – Prescription drugs are only about 15 percent of health care spending. So how could they be responsible for soaring premiums? It sounds like simple arithmetic, but it’s worth a closer look.
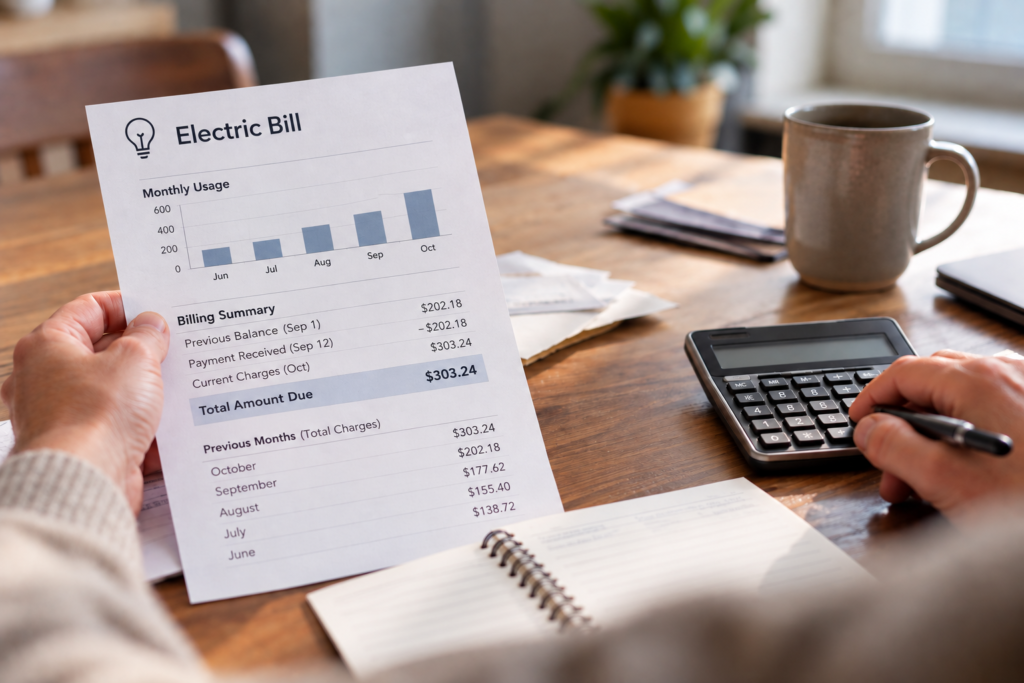
Imagine a family whose mortgage costs $2,000 a month and whose electric bill is $200. The mortgage is obviously the far bigger expense. But if the mortgage stays at $2,000 while the electric bill jumps to $300, electricity accounts for the entire increase in those two bills.
The same principle applies to health care. How much something costs today and how much it contributes to tomorrow’s increase are two different questions. A category representing 15 percent of spending can account for 25, 30 or 40 percent of an increase if it is growing much faster than everything else.
With prescription drugs, that isn’t theoretical. States are measuring it.
Texas: Yes, 15% can become 40% of the increase
Texas requires health insurers to report how prescription-drug spending affects premiums; the Texas Department of Insurance collects the results.
Reports vary enormously, which is what we should expect. In the state’s 2024 reporting, some insurers said prescription drugs had little or no effect on their premium changes. Others reported much larger effects: 31.6 percent, 39.3 percent, 42 percent, 43 percent and 48.7 percent. A few reported still higher figures.
These aren’t estimates for the Texas market as a whole; rather, they are individual insurers reporting their own experience, and the state says it does not audit the information insurers submit. But the lesson is important: a drug category representing a minority of total spending can account for 40 percent or more of the growth in premiums for a particular health plan.
And this wasn’t a one-year curiosity. Texas’s previous reporting (see here, here, and here, for example) included individual insurer figures of 46.5 percent, 54.9 percent, 63 percent and higher. Fifteen percent of the bill really can be 30 or 40 percent of the increase. It’s just basic arithmetic.
Massachusetts: 15% of spending, 23% of the increase
Now travel from one of America’s redder states to one of its bluest. Massachusetts gives us a different view: not individual insurers, but health spending across the Commonwealth.
In 2024, prescription drugs accounted for about 15 percent of Massachusetts health care spending after manufacturer rebates. But net pharmacy spending grew 10.1 percent that year – far faster than the 5.7 percent increase in health spending overall. The state’s Center for Health Information and Analysis found that pharmacy accounted for 23.2 percent of the entire increase in net health care spending. Hospital outpatient services were next, accounting for 21.8 percent.
In other words, the category representing roughly 15 percent of Massachusetts health spending was its largest identified contributor to spending growth that year.
Importantly, those numbers already account for drug-company rebates. Massachusetts estimated $4.3 billion in prescription-drug rebates in 2024. Subtract them and net pharmacy spending was still $12.3 billion, up from $11.2 billion a year earlier. Rebates are important, but you can’t answer data that already subtract rebates by pointing out that rebates exist.
There’s another wrinkle. For the first time, Massachusetts identified that about one-fifth of the growth in hospital outpatient spending was attributable to drugs administered in outpatient settings. Those costs appear under hospital outpatient care rather than pharmacy.
Not all of that spending should be attributed to drug manufacturers; hospital markups and other costs matter, too. But it is another reason to be careful with claims about how small the pharmaceutical share of health spending supposedly is.
Utah: What a difference a year makes
Utah may offer the clearest demonstration of why we should measure what is driving premiums rather than assume the answer.
In 2023, Utah’s fully insured health plans saw net prescription-drug spending jump 24 percent. Premiums rose 6.6 percent. Drug spending climbed from about 23 percent of premiums to 26.8 percent in a single year, driven by increases in brand-name and specialty medicines. The take-home message from that year is that rapidly rising drug costs put substantial upward pressure on what insurers had to finance.
Then came 2024. Drug spending fell 6.8 percent, while premiums rose another 6.4 percent. Pharmacy’s share of premiums dropped to 23.8 percent. The take-home message that year was the opposite: pharmacy plainly wasn’t driving the overall premium increase.
So that’s the same state, the same analytical approach, and the same regulator. But two different stories from two consecutive years. That’s exactly our point.
In ALDP’s view, the United States’ $5 trillion-plus health care system doesn’t have one cost problem. From a patient’s and taxpayer’s point of view, one industry’s problems don’t excuse another’s. Therefore, when asking why our nation’s health care bill is so high, we have to scrutinize hospitals, physicians, utilization trends, insurers, PBMs, and so on. And to be clear: ALDP has supported and will continue to support reforms aimed at insurer and PBM practices.
We believe in markets, but we don’t think the market for prescription drugs is working like one. That makes it vital for policymakers to scrutinize the pharmaceutical industry carefully – including its contribution to rising costs for patients, plan participants, taxpayers and employers.
Meanwhile, the national drug bill is approaching $1 trillion
The scale of the issue is becoming difficult to dismiss as a small piece of something bigger.
Researchers reported this year that U.S. prescription-drug spending reached $915 billion in 2025, an increase of 12.7 percent in just one year. They project it will cross $1 trillion in 2026, with spending rising another 10 to 12 percent.
Importantly, the researchers say the current surge is being driven primarily by more people using more medicines, though across-the-board price increases are a factor, as well.
GLP-1 medicines for diabetes and obesity are a major reason. The class accounted for nearly one-third of prescription-drug spending growth last year. New cancer treatments, specialty medicines, and therapies for diseases with few previous treatment options are contributing, too.
Many of those medicines can do tremendous good. But that doesn’t answer the question of what Americans should pay for them. In fact, the more useful a medicine becomes – and the more patients who can benefit from it – the more important it becomes to get its price right.
A good medicine can still be a bad deal
Americans aren’t simply consuming more medicines than people elsewhere. We frequently pay much more for the same products. A major RAND analysis commissioned by the U.S. Department of Health and Human Services compared American prices with those in 33 other developed countries.
There is some genuinely good news in the results. America’s generic market performs comparatively well: unbranded generic prices averaged just 67 percent of prices in the comparison countries. Generics also accounted for 90 percent of U.S. prescription volume.
Brand-name medicines were another story. U.S. gross prices for brand-name originator drugs were 422 percent of prices in the comparison countries. After researchers adjusted U.S. prices to account for estimated manufacturer rebates and discounts, American brand prices were still more than three times as high.
Medicines don’t become three times more effective when they cross into our country. A drug that controls someone’s diabetes, treats her cancer, or prevents his stroke can be very valuable. Pharmaceutical innovation deserves a fair return that supports the next generation of medicines.
But value and price are not the same thing. A house can be both valuable and overpriced. So can a car, a college education – or a medicine. The relevant question isn’t whether medicines are worth paying for; of course they are. It’s whether Americans are paying more than we should.
Who pays when drug spending rises?
Ultimately, we do.
Patients pay through premiums and out-of-pocket costs. Workers finance health coverage directly and through compensation that employers devote to benefits. Businesses pay a large share of the cost of employer-sponsored insurance. Taxpayers finance Medicare, Medicaid, and public-employee health plans. These aren’t really separate groups. Most of us find ourselves in more than one of these categories.
That is why rapidly growing health spending can affect people even when we never see a bill bearing the words “prescription drug.” The cost can show up in a premium, a paycheck, a tax bill, or at the pharmacy counter.
The national evidence points in the same direction. Milliman’s 2026 Medical Index found pharmacy to be the fastest-growing major component of employer-sponsored health costs, increasing 14.8 percent, compared to 7.9 percent for health care costs overall. Pharmacy and outpatient facility care together account for 69 percent of the increase; Milliman also noted that provider-administered specialty medicines are contributing to outpatient growth.
Look at what is making the bill grow
There is nothing wrong with asking what percentage of health spending goes toward prescription drugs. It’s useful information. But no one should conflate the level of spending with the growth in that spending.
The mortgage may remain the biggest item in the family budget while electricity accounts for most of this year’s increase. Likewise, hospitals can consume more health care dollars overall while prescription drugs grow faster and account for an outsized share of new spending.
Texas insurers have reported prescription drugs accounting for 30, 40 percent or more of premium growth. Massachusetts found pharmacy responsible for 23.2 percent of its net health-spending growth in 2024. Utah saw net drug spending surge 24 percent one year and fall 6.8 percent the next.
We know of no national data that comprehensively answer how much prescription-drug spending is contributing to overall premium growth (though the National Academy of State Health Policy has a good state-by-state roundup). The federal government is now collecting drug spending, rebate, medical spending, and premium data across the private insurance market in part to better understand that relationship.
That is also the value of state-level transparency. Texas, Massachusetts, and Utah use different approaches, but each has required the collection and analysis of data that help policymakers see what is actually driving health care costs. A Sunshine PDAB can serve the same purpose: it doesn’t set prices, but it builds an evidence base for policymakers to decide whether – and where – action is warranted.
With America on track to spend more than $1 trillion on prescription drugs this year while paying roughly three times what comparable countries pay for brand-name medicines after estimated rebates, drug spending deserves careful scrutiny.
The size of the slice matters. But so does how fast it is growing – and how much we’re paying for it.